Physical Address
304 North Cardinal St.
Dorchester Center, MA 02124
Physical Address
304 North Cardinal St.
Dorchester Center, MA 02124

In trading, there are different styles to approach the markets — intraday trading, swing trading, and long-term investing. Somewhere in the middle lies positional trading. The idea is simple: instead of reacting to every daily fluctuation, positional traders focus on the bigger trend and hold their trades for weeks or even months.
This RSI-based strategy is designed specifically for positional traders. The goal is to filter noise, identify strong momentum, and capture sizable market moves. Unlike short-term traders who constantly jump in and out, positional traders wait patiently for high-probability setups and then ride the trend until it weakens.
The beauty of this approach is that it doesn’t require you to sit in front of the screen all day. You can simply review the charts at the end of each week and make decisions calmly. While this strategy works across multiple timeframes (daily, weekly, and monthly), in this article we’ll focus on the weekly timeframe, which offers a great balance between catching long swings and avoiding unnecessary false signals.
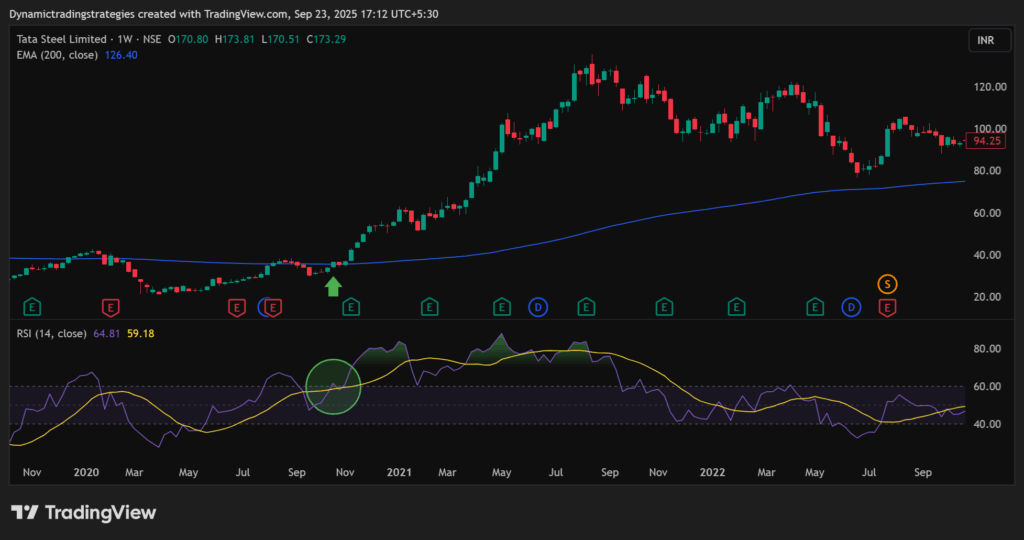
The Relative Strength Index (RSI) is one of the most widely used momentum indicators. Many traders misuse it by simply calling RSI above 70 “overbought” and below 30 “oversold.” That approach might work for scalping or very short-term setups, but positional traders need something more reliable.
The real strength of RSI for positional trading comes when we focus on the 60 and 40 levels instead of the classic 70 and 30 zones. Here’s why:
In other words, RSI acts like a momentum filter for positional traders. Instead of guessing whether a stock is overbought or oversold, we focus on whether the market has enough strength to sustain a move. Combined with other tools like the 200 EMA (for long-term trend confirmation) and Supertrend (for trailing stops), RSI becomes a powerful foundation for a rules-based trading strategy.
📈 Buy Rules (Long Trades):
Entries are important, but exits decide profitability. This strategy uses a dual exit system:
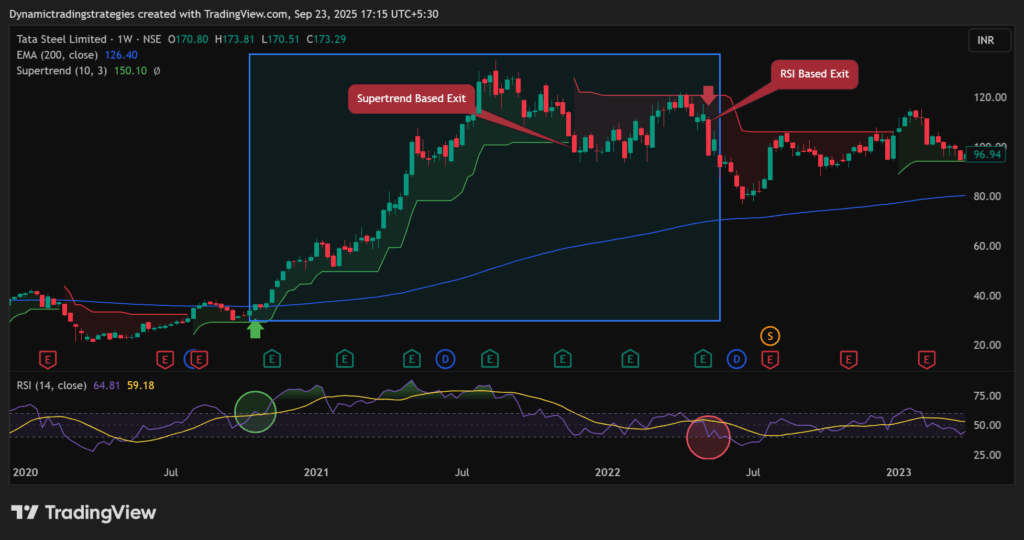
This combination ensures you capture most of the trend while locking in profits as the move matures.
Not all RSI signals should be traded. To reduce false signals and improve accuracy, we use the following filters:
By applying these filters, the win rate and profitability of the strategy improve significantly.
This RSI positional trading strategy is simple, practical, and highly effective for traders who want to capture big moves without constant monitoring.
✅ Buy when RSI crosses above 60 on the weekly chart, with price above 200 EMA.
✅ Exit when RSI drops below 40 or when Supertrend triggers.
✅ Use the 200 EMA filter to stay aligned with the long-term trend.
The strength of this approach lies in its discipline. You don’t need to chase every move — you only trade when conditions are ideal. This reduces overtrading and helps focus on quality setups.
Before going live, it’s essential to backtest this strategy on historical charts and paper trade it to build confidence. Every stock behaves differently, and results may vary across sectors and market conditions.
If followed with patience and proper risk management, this RSI strategy can become a reliable part of your positional trading toolkit — helping you stay on the right side of the trend and maximize returns while keeping risks under control.